
EN | ES
EN | ES
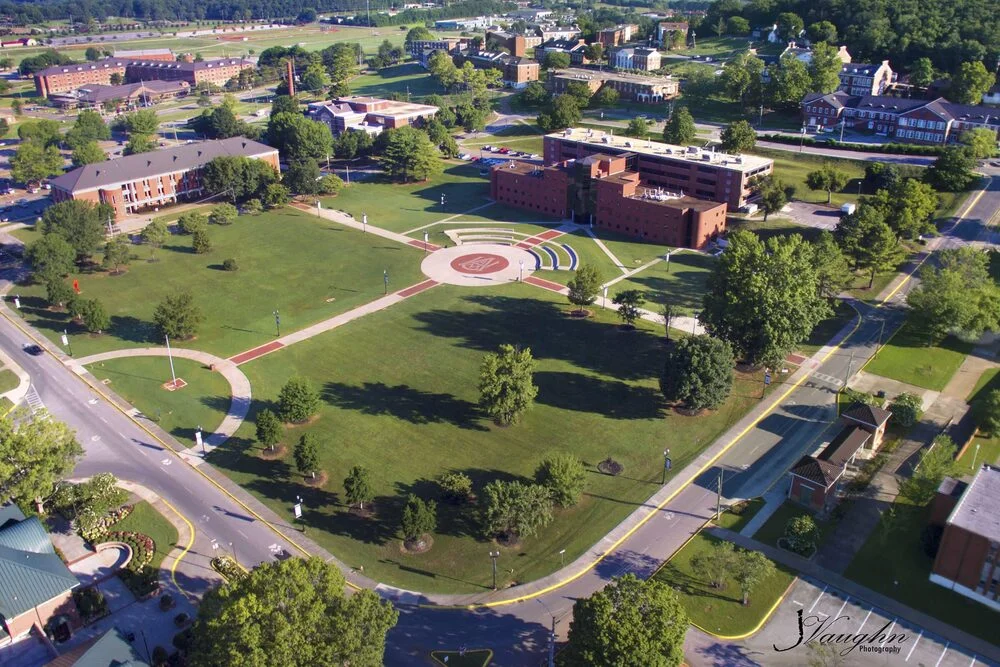
Alabama A & M University founded in 1875 and located in Huntsville, Alabama, USA. The university offers Pell Grants and other federal aid for eligible students. University offering Academic and continuing professional education. Dual, credit for life, or AP credits does not accepted.
Find below Tuition fees and Estimated Students Expenses. This section explains the estimated costs for full-time first-year undergraduate students, specifically those who are entering postsecondary education for the first time.
| Estimated expenses for academic year | 2021-2022 | 2022-2023 | 2023-2024 | 2024-2025 | % change 2023-2024 to 2024-2025 |
|---|---|---|---|---|---|
| Tuition and fees | |||||
| In-state | $10,024 | $10,024 | $10,024 | $10,024 | 0.0% |
| Out-of-state | $18,634 | $18,634 | $18,634 | $18,634 | 0.0% |
| Books and supplies | $1,600 | $1,600 | $2,192 | $2,270 | 3.6% |
| Living arrangement | |||||
| On Campus | |||||
| Food and Housing | $9,520 | $9,520 | $11,402 | $11,402 | 0.0% |
| Other expenses | $3,090 | $3,090 | $3,864 | $4,036 | 4.5% |
| Off Campus | |||||
| Food and Housing | $9,520 | $9,520 | $11,402 | $11,402 | 0.0% |
| Other expenses | $3,090 | $3,090 | $3,864 | $4,036 | 4.5% |
| Off Campus with Family | |||||
| Food and Housing | – | – | – | $11,402 | – |
| Other expenses | $3,440 | $3,440 | $4,271 | $4,036 | -5.5% |
| Total Expenses | 2021-2022 | 2022-2023 | 2023-2024 | 2024-2025 | % change 2023-2024 to 2024-2025 |
| In-state | |||||
| On Campus | $24,234 | $24,234 | $27,482 | $27,732 | 0.9% |
| Off Campus | $24,234 | $24,234 | $27,482 | $27,732 | 0.9% |
| Off Campus with Family | $15,064 | $15,064 | $16,487 | $16,330 | -1.0% |
| Out-of-state | |||||
| On Campus | $32,844 | $32,844 | $36,092 | $36,342 | 0.7% |
| Off Campus | $32,844 | $32,844 | $36,092 | $36,342 | 0.7% |
| Off Campus with Family | $23,674 | $23,674 | $25,097 | $24,940 | -0.6% |
This section explains the estimated costs for full-time graduate students:
| Tuition and fees for academic year | 2024-2025 |
|---|---|
| In-state tuition | $7,596 |
| In-state fees | $1,414 |
| Out-of-state tuition | $15,192 |
| Out-of-state fees | $1,414 |
Full-time beginning undergraduate students are first-year students enrolled full-time who are entering postsecondary (college-level) education for the first time.
| Type of Aid | Number awarded aid | Percent awarded aid | Total amount of aid awarded | Average amount of aid awarded |
|---|---|---|---|---|
| Any student financial aid1 | 1,769 | 90% | —— | —— |
| Grant or scholarship aid | 1,698 | 86% | $21,809,164 | $12,844 |
| Federal grants | 1,332 | 67% | $9,021,849 | $6,773 |
| Pell grants | 1,328 | 67% | $8,756,692 | $6,594 |
| Other federal grants | 123 | 6% | $265,157 | $2,156 |
| State/local government grant or scholarships | 66 | 3% | $112,137 | $1,699 |
| Institutional grants or scholarships | 1,330 | 67% | $12,675,178 | $9,530 |
| Student loan aid | 1,503 | 76% | $10,345,864 | $6,883 |
| Federal student loans | 1,493 | 76% | $9,292,472 | $6,224 |
| Other student loans | 108 | 5% | $1,053,392 | $9,754 |
Financial Aid for all undergraduate students:
| Type of Aid | Number awarded aid | Percent awarded aid | Total amount of aid awarded | Average amount of aid awarded |
|---|---|---|---|---|
| Degree/certificate-seeking | ||||
| Grant or scholarship aid1 | 4,660 | 81% | $58,226,923 | $12,495 |
| Pell grants | 3,681 | 64% | $23,657,349 | $6,427 |
| Federal student loans | 4,357 | 76% | $30,301,705 | $6,955 |
| Non-degree/non-certificate-seeking | ||||
| Grant or scholarship aid1 | 0 | 0% | $0 | — |
Average Net Price for Full-Time First-Time Students:
Full-time first-time undergraduate students who paid in-state or in-district tuition and received grant or scholarship aid from the federal government, state/local governments, or the institution.
| 2021-2022 | 2022-2023 | 2023-2024 | |
| Average net price | $14,600 | $14,064 | $17,152 |
Full-time first-time undergraduate students who paid in-state or in-district tuition and received Title IV financial aid, grouped by income level.
| Average net price by Income | 2021-2022 | 2022-2023 | 2023-2024 |
|---|---|---|---|
| $0 – $30,000 | $14,205 | $13,776 | $16,500 |
| $30,001 – $48,000 | $14,526 | $13,923 | $16,387 |
| $48,001 – $75,000 | $16,532 | $16,471 | $19,622 |
| $75,001 – $110,000 | $20,139 | $19,057 | $21,680 |
| $110,001 and more | $17,539 | $18,200 | $20,364 |
Fall 2024 Enrollment Statistics:
| Total enrollment | 7,295 |
|---|---|
| Undergraduate enrollment | 6,370 |
| Undergraduate transfer-in enrollment | 225 |
| Graduate enrollment | 925 |
| Total | Male | Female | |
| Number of applicants | 23,406 | 7,568 | 14,930 |
| Percent admitted | 58% | 61% | 60% |
| Percent admitted who enrolled | 15% | 18% | 13% |
Test scores for first time enrolled students (Fall 2024)
| Students submitting scores | Number | Percent |
|---|---|---|
| SAT | 537 | 27% |
| ACT | 1,317 | 67% |
| 25th Percentile* | 50th Percentile** (median) | 75th Percentile*** |
|---|---|---|
| 420 | 470 | 530 |
| 390 | 440 | 510 |
| 14 | 17 | 19 |
| 13 | 16 | 19 |
| 14 | 16 | 17 |
Below you can find all majors and programs:
| Program | Postgraduate Certificate | Bachelor | Master | Doctor |
|---|---|---|---|---|
| Agricultural/Animal/Plant/Veterinary Science and Related Fields | ||||
| Agricultural/Animal/Plant/Veterinary Science and Related Fields, Other | – | 2 | 9 | 3 |
| Animal Sciences, Other | – | 12 | – | – |
| Food Science | – | 10 | 7 | 6 |
| Category total | – | 24 | 16 | 9 |
| Architecture and Related Services | ||||
| City/Urban, Community, and Regional Planning | – | 8 | 10 | – |
| Category total | – | 8 | 10 | – |
| Biological and Biomedical Sciences | ||||
| Biology/Biological Sciences, General | – | 83 | 9 | – |
| Biotechnology | – | 1 | – | – |
| Category total | – | 84 | 9 | – |
| Business, Management, Marketing, and Related Support Services | ||||
| Accounting | – | 10 | – | – |
| Business Administration and Management, General | – | 52 | 38d | – |
| Entrepreneurship/Entrepreneurial Studies | – | 6 | – | – |
| Finance, General | – | 10 | – | – |
| Logistics, Materials, and Supply Chain Management | – | 15 | – | – |
| Marketing/Marketing Management, General | – | 6 | – | – |
| Category total | – | 99 | 38d | – |
| Communication, Journalism, and Related Programs | ||||
| Communication and Media Studies, Other | – | – | 11 | – |
| Category total | – | – | 11 | – |
| Communications Technologies/Technicians and Support Services | ||||
| Radio and Television Broadcasting Technology/Technician | – | 32 | – | – |
| Category total | – | 32 | – | – |
| Computer and Information Sciences and Support Services | ||||
| Computer and Information Sciences, General | – | 25 | 11 | – |
| Category total | – | 25 | 11 | – |
| Education | ||||
| Early Childhood Education and Teaching | – | 3 | 1 | – |
| Education, General | 1 | – | – | – |
| Education/Teaching of Individuals with Speech or Language Impairments | – | 11 | – | – |
| Educational Leadership and Administration, General | – | – | 3d | – |
| Elementary Education and Teaching | – | 6 | 5 | – |
| Physical Education Teaching and Coaching | – | 5 | – | – |
| Reading Teacher Education | – | – | – | 0 |
| Secondary Education and Teaching | – | – | 2 | – |
| Special Education and Teaching, General | – | 0 | 1 | – |
| Category total | 1 | 25 | 12d | 0 |
| Engineering | ||||
| Civil Engineering, General | – | 10 | – | – |
| Electrical and Electronics Engineering | – | 17 | 0 | – |
| Engineering, Other | – | – | 30 | – |
| Mechanical Engineering | – | 37 | 3 | – |
| Category total | – | 64 | 33 | – |
| Engineering/Engineering-related Technologies/Technicians | ||||
| Construction Engineering Technology/Technician | – | 12 | – | – |
| Category total | – | 12 | – | – |
| English Language and Literature/Letters | ||||
| English Language and Literature, General | – | 7 | – | – |
| Category total | – | 7 | – | – |
| Family and Consumer Sciences/Human Sciences | ||||
| Family and Consumer Sciences/Human Sciences, General | – | 11 | 2 | – |
| Category total | – | 11 | 2 | – |
| Health Professions and Related Programs | ||||
| Speech-Language Pathology/Pathologist | – | – | 16 | – |
| Category total | – | – | 16 | – |
| Homeland Security, Law Enforcement, Firefighting and Related Protective Services | ||||
| Criminal Justice/Law Enforcement Administration | – | 38 | – | – |
| Category total | – | 38 | – | – |
| Liberal Arts and Sciences, General Studies and Humanities | ||||
| General Studies | – | 39 | – | – |
| Category total | – | 39 | – | – |
| Mathematics and Statistics | ||||
| Mathematics, General | – | 3 | – | – |
| Category total | – | 3 | – | – |
| Natural Resources and Conservation | ||||
| Forestry, Other | – | 0 | – | – |
| Category total | – | 0 | – | – |
| Parks, Recreation, Leisure, Fitness, and Kinesiology | ||||
| Exercise Science and Kinesiology | – | – | 5 | – |
| Sport and Fitness Administration/Management | – | 22 | – | – |
| Category total | – | 22 | 5 | – |
| Physical Sciences | ||||
| Chemistry, General | – | 11 | – | – |
| Physics, General | – | 3 | 1 | – |
| Physics, Other | – | – | – | 2 |
| Category total | – | 14 | 1 | 2 |
| Psychology | ||||
| Counseling Psychology | – | – | 13 | – |
| Psychology, General | – | 33 | – | – |
| Category total | – | 33 | 13 | – |
| Public Administration and Social Service Professions | ||||
| Social Work | – | 26 | 52 | – |
| Category total | – | 26 | 52 | – |
| Social Sciences | ||||
| Political Science and Government, General | – | 11 | – | – |
| Sociology, General | – | 2 | – | – |
| Category total | – | 13 | – | – |
| Visual and Performing Arts | ||||
| Art/Art Studies, General | – | 0 | – | – |
| Fine/Studio Arts, General | – | 4 | – | – |
| Music, General | – | 7 | – | – |
| Category total | – | 11 | – | – |
| Grand total | 1 | 590 | 229 | 11 |
Find below on campus security informations/datas:
| Criminal Offenses | 2019 | 2020 | 2021 |
| a. Murder/Non-negligent manslaughter | 0 | 0 | 0 |
| b. Negligent manslaughter | 0 | 0 | 0 |
| c. Rape | 4 | 2 | 2 |
| d. Fondling | 2 | 0 | 1 |
| e. Incest | 0 | 0 | 0 |
| f. Statutory Rape | 0 | 0 | 0 |
| g. Robbery | 0 | 0 | 1 |
| h. Aggravated assault | 0 | 0 | 0 |
| i. Burglary | 19 | 5 | 8 |
| j. Motor vehicle theft | 0 | 0 | 0 |
| k. Arson | 0 | 0 | 0 |
| VAWA Offenses | 2019 | 2020 | 2021 |
| a. Domestic violence | 20 | 4 | 2 |
| b. Dating violence | 4 | 1 | 3 |
| c. Stalking | 0 | 0 | 1 |
| Arrests | 2019 | 2020 | 2021 |
| a. Weapons: carrying, possessing, etc. | 12 | 4 | 1 |
| b. Drug abuse violations | 28 | 9 | 7 |
| c. Liquor law violations | 0 | 0 | 0 |
| Disciplinary Actions | 2019 | 2020 | 2021 |
| a. Weapons: carrying, possessing, etc. | 5 | 2 | 3 |
| b. Drug abuse violations | 124 | 87 | 47 |
| c. Liquor law violations | 9 | 1 | 5 |
Find below off campus security informations/datas:
| Criminal Offenses | 2019 | 2020 | 2021 |
| a. Murder/Non-negligent manslaughter | 0 | 0 | 0 |
| b. Negligent manslaughter | 0 | 0 | 0 |
| c. Rape | 3 | 2 | 2 |
| d. Fondling | 1 | 0 | 0 |
| e. Incest | 0 | 0 | 0 |
| f. Statutory Rape | 0 | 0 | 0 |
| g. Robbery | 0 | 0 | 1 |
| h. Aggravated assault | 0 | 0 | 0 |
| i. Burglary | 19 | 5 | 8 |
| j. Motor vehicle theft | 0 | 0 | 0 |
| k. Arson | 0 | 0 | 0 |
| VAWA Offenses | 2019 | 2020 | 2021 |
| a. Domestic violence | 16 | 4 | 2 |
| b. Dating violence | 4 | 1 | 2 |
| c. Stalking | 0 | 0 | 0 |
| Arrests | 2019 | 2020 | 2021 |
| a. Weapons: carrying, possessing, etc. | 5 | 4 | 1 |
| b. Drug abuse violations | 13 | 5 | 4 |
| c. Liquor law violations | 0 | 0 | 0 |
| Disciplinary Actions | 2019 | 2020 | 2021 |
| a. Weapons: carrying, possessing, etc. | 2 | 2 | 3 |
| b. Drug abuse violations | 90 | 79 | 30 |
| c. Liquor law violations | 4 | 1 | 3 |